Java虚拟机(五)经典的垃圾收集器

垃圾收集器

垃圾收集算法,都是一个原理,这些算法的实现的最终结果,就是垃圾收集器。每个垃圾收集器虽然算法上类似,但是各个都有着自己的优势。如图:

jvm7

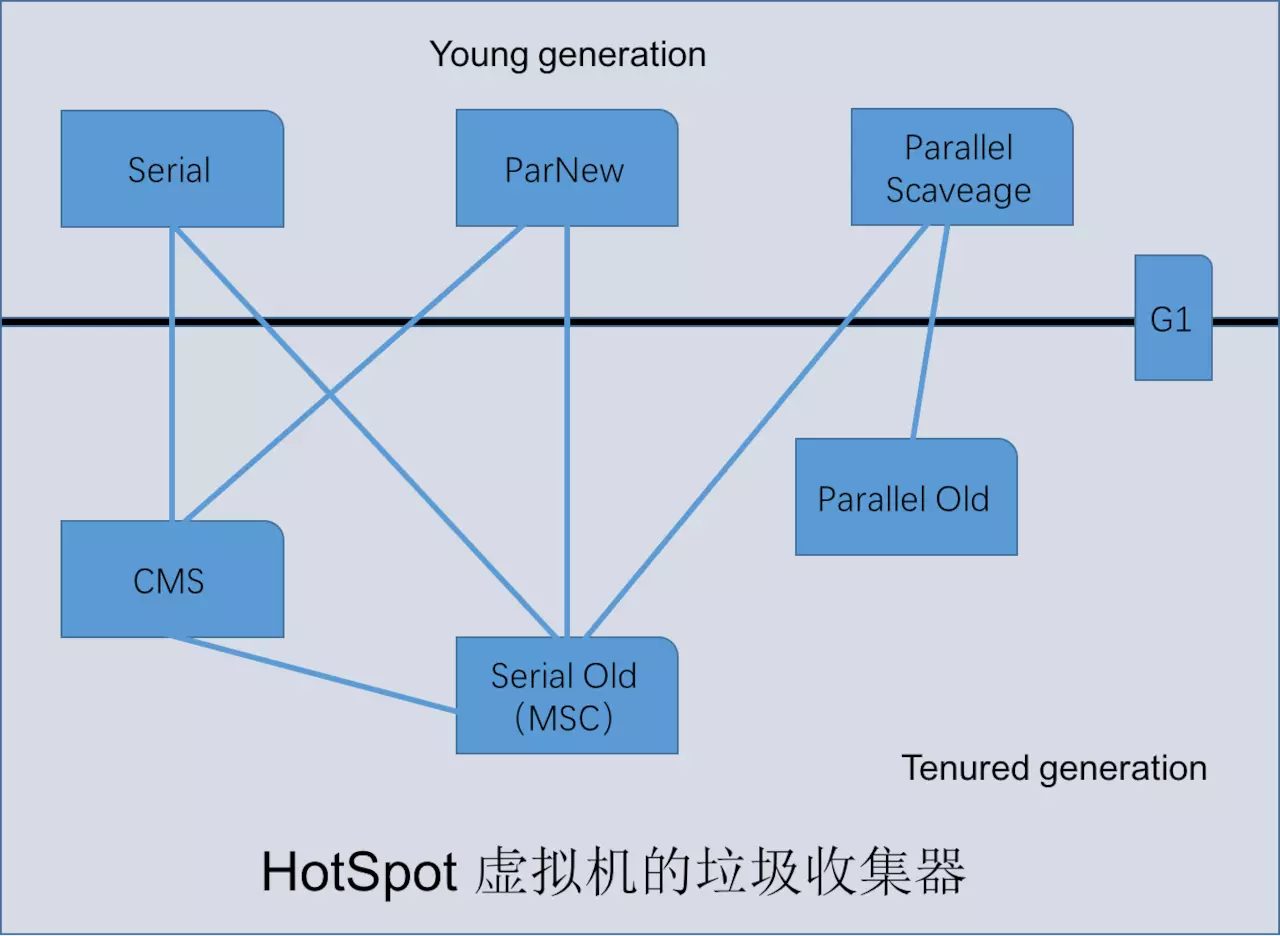
这七个就是是如今比较流行的垃圾收集器。它们都是在分代收集算法的策略下运行的。

Serial收集器

这是一个最古老的垃圾收集器,现在几乎不被使用了。它的原理非常简单,就是在进行垃圾收集的时候暂停所有的线程。

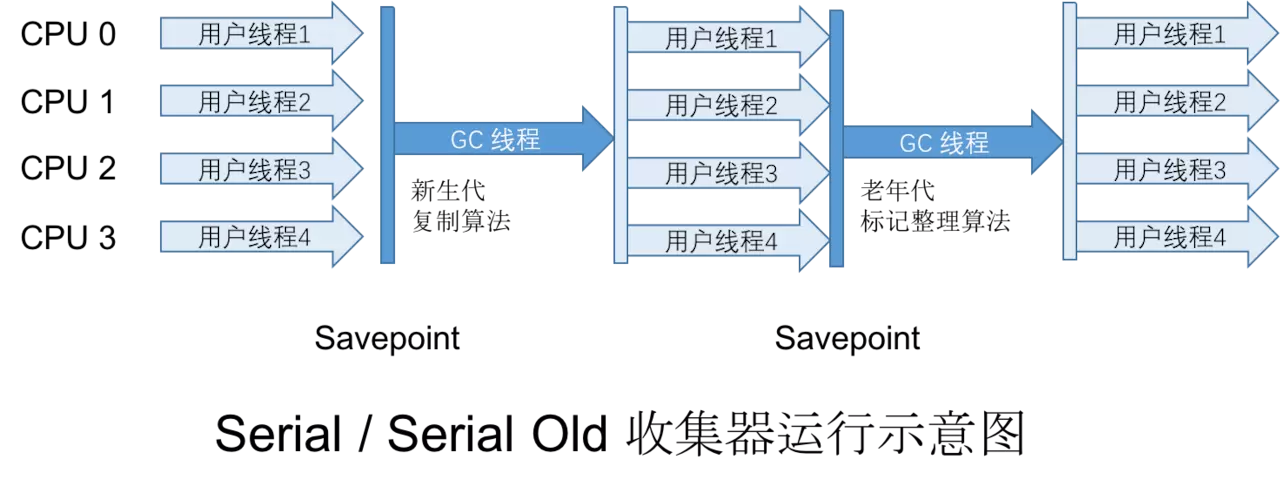
正如图所示,这是一个单核的垃圾收集器,会在新生代使用复制算法,在老年代执行整理算法。一般在收集几十兆的新生代,所暂停的时间也仅仅在十几毫秒以内,对于运行在客户端模式下的虚拟机而言,也是可以接受的。

Serial Old收集器

Serial Old收集器是Serial收集器的老年版本。它经常被用来与其他收集器搭配使用。一般的搭档是 Parallel Scavenge收集器,还有一个就是作为CMS收集器发生失败时的后备预案。

ParNew收集器

ParNew收集器是Serial收集器的多线程版本。

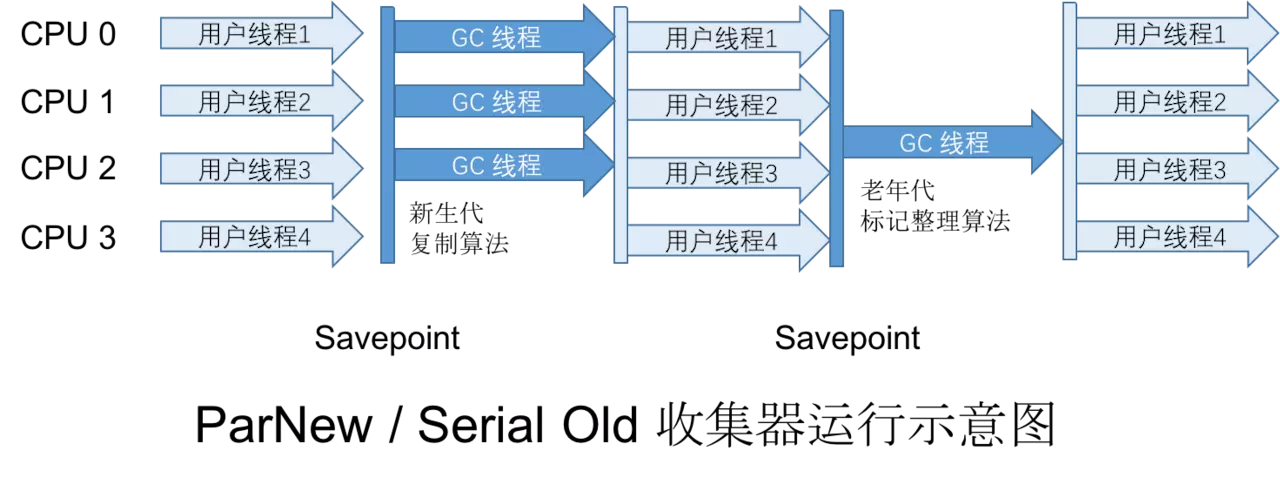
遗憾的是ParNew收集器仅仅只有复制算法实现了多线程,在标记整理当中,还是需要Serial Old收集器,暂停所有的线程来进行回收内存。但垃圾收集器并不是只能使用一种类型,ParNew收集器还能和CMS收集器结合在一起,实现完全的多线程垃圾收集。

Parallel Scabenge和Parallel Old收集器

Parallel Scabenge和Parallel Old并不是同一时期的产物,是先有了Parallel Scabenge收集器,然后在JDK6的时候才提供了Parallel Old收集器,之后我们可以统称为Parallel收集器。运行效果如图:

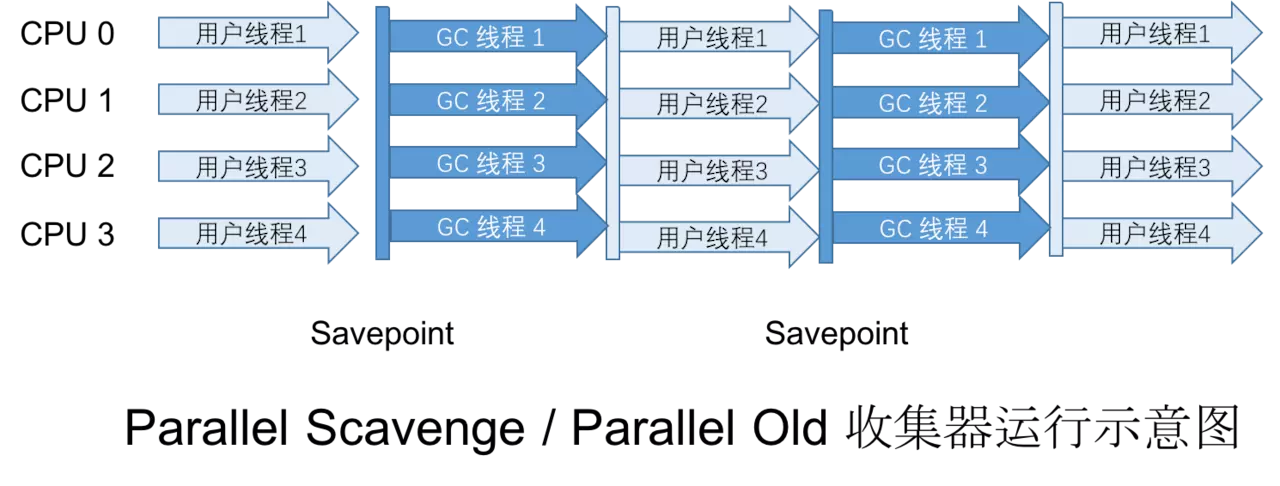
Parallel收集器的特点和其他的收集都有着很大的不同,这个收集器不把目光局限于缩短线程停顿的时间,而是引入了一个新的名词:吞吐量

吞吐量(Throughput = 运行用户代码时间 / (运行用户代码时间 + 垃圾收集时间))。

如果虚拟机完成某个任务,用户代码加上垃圾收集总共耗费了100分钟,其中垃圾收集花掉了一分钟,那么吞吐量就是99%。

可以通过 -XX:MaxGCPauseMills 参数设置内存回收花费最大时间, -XX:GCTimeRatio 设置垃圾收集时间占总时间的比率。-XX:+UseAdaptiveSizePolicy开启自动吞吐量控制。

作为一个吞吐量优先的收集器,虚拟机会根据当前系统的运行情况收集性能监控信息,动态调整停顿时间。这就是 GC 的自适应调整策略(GC Ergonomics)。

JDK8用的正是这种模式的收集器

CMS收集器

CMS收集器是一个基于标记清除算法的,能并发收集,低停顿的收集器。

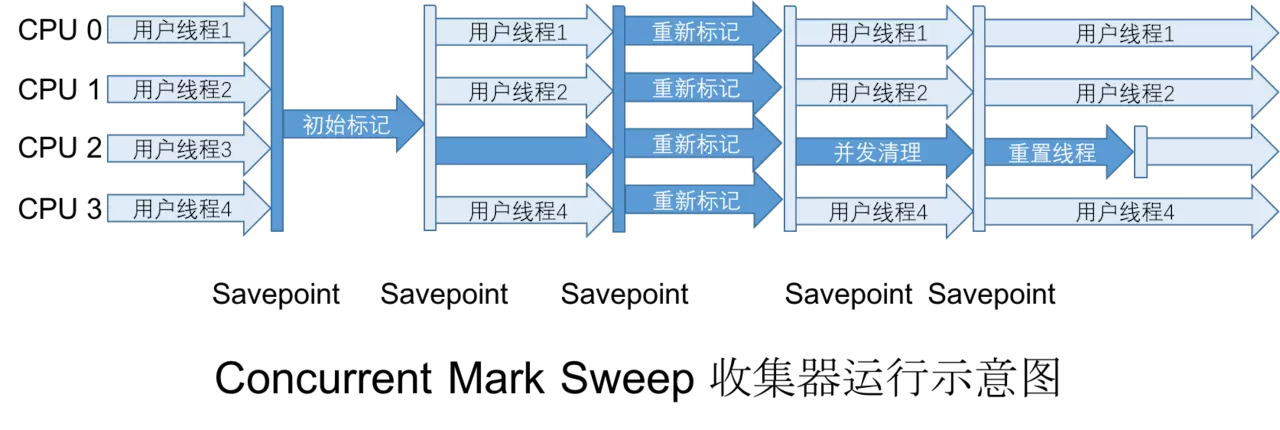
这个收集器的运行过程更为复杂,整个过程分为四个阶段:

  1. 初始标记
  2. 并发标记
  3. 重新标记
  4. 并发清除

可惜的是这个收集器无法处理“浮动垃圾”,并且也可能会产生内存碎片过多的问题,目前并未广泛的投入使用。

G1收集器

G1收集器是在垃圾收集器技术发展史上的一个里程碑式的成果。G1的进行回收的标准不再是它属于哪个分代,而是哪块内存中存放的垃圾数量最大,回收收益最大,这就是G1的Mixed GC模式。

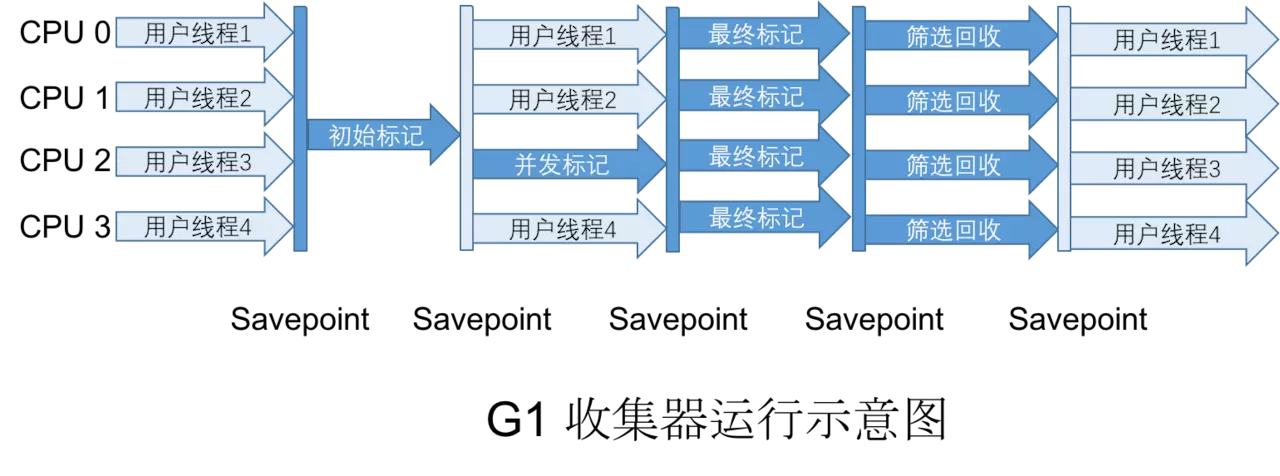
这个收集器开创了面向局部收集的设计思路和基于Region的内存布局形式,同样有着四个阶段:

  1. 初始标记:仅仅只是标记一下GC Roots能直接关联到的对象。
  2. 并发标记:开始进行可达性分析。
  3. 最终标记:处理并发阶段遗留的SATB记录。
  4. 筛选回收:对各个Region的价值和回收成本进行排序,然后回收。

就目前从JDK9到最新的JDK13而言,使用的正是G1收集器。这也是收集器未来的发展趋势。

shenandoah收集器

拥有九个阶段的、及其复杂的收集器,是基于G1的思想研发出来,目前处于试验状态。

ZGC收集器

引入的染色指针的概念,也是基于G1的思想,而且对并发整理算法有着特别的改进,是一个新的低延迟收集器,目前也处于试验状态。

Epsilon收集器

拥有自动内存管理子系统的收集器。不以垃圾回收为关注点,而是集中在内存管理方面,是一个在只需要运行数分钟就关闭的应用上,有着极其低延迟的收集器。

如何查看GC日志

我们在进行调优的时候,往往需要根据GC情况来进行,但是我们该怎么得知GC信息呢?

查看GC详细信息

在JDK9之前使用-XX:+PrintGCDetails查看GC日志

1
2
3
4
5
6
7
8
9
10
11
12
13
14
15
16
17
18
19
20
21
22
23
24
25
26
27
28
29
30
31
32
33
34
35
36
37
38
39
40
//JDK8
//-XX:+PrintGCDetails
public class test {
public Object instance = null;

private static final int _1MB = 1024 * 1024;

/**
* 这个成员属性的唯一意义就是占点内存,以便在能在GC日志中看清楚是否有回收过
*/
private byte[] bigSize = new byte[2 * _1MB];

public static void main(String[] args) {

test objA = new test();
test objB = new test();
objA.instance = objB;
objB.instance = objA;

objA = null;
objB = null;

// 假设在这行发生GC,objA和objB是否能被回收?
System.gc();
}
}


/*
[GC (System.gc()) [PSYoungGen: 6425K->760K(33280K)] 6425K->768K(110080K), 0.0019406 secs] [Times: user=0.00 sys=0.00, real=0.00 secs]
[Full GC (System.gc()) [PSYoungGen: 760K->0K(33280K)] [ParOldGen: 8K->581K(76800K)] 768K->581K(110080K), [Metaspace: 3099K->3099K(1056768K)], 0.0054005 secs] [Times: user=0.11 sys=0.00, real=0.01 secs]
Heap
PSYoungGen total 33280K, used 860K [0x00000000daf80000, 0x00000000dd480000, 0x0000000100000000)
eden space 28672K, 3% used [0x00000000daf80000,0x00000000db057230,0x00000000dcb80000)
from space 4608K, 0% used [0x00000000dcb80000,0x00000000dcb80000,0x00000000dd000000)
to space 4608K, 0% used [0x00000000dd000000,0x00000000dd000000,0x00000000dd480000)
ParOldGen total 76800K, used 581K [0x0000000090e00000, 0x0000000095900000, 0x00000000daf80000)
object space 76800K, 0% used [0x0000000090e00000,0x0000000090e917e0,0x0000000095900000)
Metaspace used 3121K, capacity 4496K, committed 4864K, reserved 1056768K
class space used 340K, capacity 388K, committed 512K, reserved 1048576K

在JDK9以及之后使用-Xlog:gc*查看GC日志

1
2
3
4
5
6
7
8
9
10
11
12
13
14
15
16
17
18
19
20
21
22
23
24
25
26
27
28
29
30
31
32
33
34
35
36
37
38
39
40
41
42
43
44
45
46
47
48
49
50
51
52
53
54
55
//-Xlog:gc*
//JDK13

public class test {
public Object instance = null;

private static final int _1MB = 1024 * 1024;

/**
* 这个成员属性的唯一意义就是占点内存,以便在能在GC日志中看清楚是否有回收过
*/
private byte[] bigSize = new byte[2 * _1MB];

public static void main(String[] args) {

test objA = new test();
test objB = new test();
objA.instance = objB;
objB.instance = objA;

objA = null;
objB = null;

// 假设在这行发生GC,objA和objB是否能被回收?
System.gc();
}
}
/*
[0.014s][info][gc,heap] Heap region size: 1M
[0.017s][info][gc ] Using G1
[0.017s][info][gc,heap,coops] Heap address: 0x0000000090e00000, size: 1778 MB, Compressed Oops mode: 32-bit
[0.039s][info][gc ] Periodic GC disabled
[0.088s][info][gc,task ] GC(0) Using 2 workers of 8 for full compaction
[0.088s][info][gc,start ] GC(0) Pause Full (System.gc())
[0.089s][info][gc,phases,start] GC(0) Phase 1: Mark live objects
[0.090s][info][gc,phases ] GC(0) Phase 1: Mark live objects 1.420ms
[0.090s][info][gc,phases,start] GC(0) Phase 2: Prepare for compaction
[0.090s][info][gc,phases ] GC(0) Phase 2: Prepare for compaction 0.351ms
[0.090s][info][gc,phases,start] GC(0) Phase 3: Adjust pointers
[0.091s][info][gc,phases ] GC(0) Phase 3: Adjust pointers 0.674ms
[0.091s][info][gc,phases,start] GC(0) Phase 4: Compact heap
[0.092s][info][gc,phases ] GC(0) Phase 4: Compact heap 0.484ms
[0.093s][info][gc,heap ] GC(0) Eden regions: 2->0(2)
[0.093s][info][gc,heap ] GC(0) Survivor regions: 0->0(0)
[0.093s][info][gc,heap ] GC(0) Old regions: 0->2
[0.093s][info][gc,heap ] GC(0) Archive regions: 0->0
[0.093s][info][gc,heap ] GC(0) Humongous regions: 6->0
[0.093s][info][gc,metaspace ] GC(0) Metaspace: 339K->339K(1056768K)
[0.093s][info][gc ] GC(0) Pause Full (System.gc()) 7M->0M(8M) 4.329ms
[0.093s][info][gc,cpu ] GC(0) User=0.00s Sys=0.00s Real=0.01s
[0.094s][info][gc,heap,exit ] Heap
[0.094s][info][gc,heap,exit ] garbage-first heap total 8192K, used 751K [0x0000000090e00000, 0x0000000100000000)
[0.094s][info][gc,heap,exit ] region size 1024K, 1 young (1024K), 0 survivors (0K)
[0.094s][info][gc,heap,exit ] Metaspace used 343K, capacity 4494K, committed 4864K, reserved 1056768K
[0.094s][info][gc,heap,exit ] class space used 22K, capacity 386K, committed 512K, reserved 1048576K

查看GC前后堆

JDK9之前使用-XX:+PrintHeapAtGC

1
2
3
4
5
6
7
8
9
10
11
12
13
14
15
16
17
18
19
20
21
22
23
24
25
26
27
28
29
30
31
32
33
34
35
36
37
38
{Heap before GC invocations=1 (full 0):
PSYoungGen total 33280K, used 6425K [0x00000000daf80000, 0x00000000dd480000, 0x0000000100000000)
eden space 28672K, 22% used [0x00000000daf80000,0x00000000db5c6570,0x00000000dcb80000)
from space 4608K, 0% used [0x00000000dd000000,0x00000000dd000000,0x00000000dd480000)
to space 4608K, 0% used [0x00000000dcb80000,0x00000000dcb80000,0x00000000dd000000)
ParOldGen total 76800K, used 0K [0x0000000090e00000, 0x0000000095900000, 0x00000000daf80000)
object space 76800K, 0% used [0x0000000090e00000,0x0000000090e00000,0x0000000095900000)
Metaspace used 3204K, capacity 4496K, committed 4864K, reserved 1056768K
class space used 347K, capacity 388K, committed 512K, reserved 1048576K
Heap after GC invocations=1 (full 0):
PSYoungGen total 33280K, used 824K [0x00000000daf80000, 0x00000000dd480000, 0x0000000100000000)
eden space 28672K, 0% used [0x00000000daf80000,0x00000000daf80000,0x00000000dcb80000)
from space 4608K, 17% used [0x00000000dcb80000,0x00000000dcc4e030,0x00000000dd000000)
to space 4608K, 0% used [0x00000000dd000000,0x00000000dd000000,0x00000000dd480000)
ParOldGen total 76800K, used 8K [0x0000000090e00000, 0x0000000095900000, 0x00000000daf80000)
object space 76800K, 0% used [0x0000000090e00000,0x0000000090e02000,0x0000000095900000)
Metaspace used 3204K, capacity 4496K, committed 4864K, reserved 1056768K
class space used 347K, capacity 388K, committed 512K, reserved 1048576K
}
{Heap before GC invocations=2 (full 1):
PSYoungGen total 33280K, used 824K [0x00000000daf80000, 0x00000000dd480000, 0x0000000100000000)
eden space 28672K, 0% used [0x00000000daf80000,0x00000000daf80000,0x00000000dcb80000)
from space 4608K, 17% used [0x00000000dcb80000,0x00000000dcc4e030,0x00000000dd000000)
to space 4608K, 0% used [0x00000000dd000000,0x00000000dd000000,0x00000000dd480000)
ParOldGen total 76800K, used 8K [0x0000000090e00000, 0x0000000095900000, 0x00000000daf80000)
object space 76800K, 0% used [0x0000000090e00000,0x0000000090e02000,0x0000000095900000)
Metaspace used 3204K, capacity 4496K, committed 4864K, reserved 1056768K
class space used 347K, capacity 388K, committed 512K, reserved 1048576K
Heap after GC invocations=2 (full 1):
PSYoungGen total 33280K, used 0K [0x00000000daf80000, 0x00000000dd480000, 0x0000000100000000)
eden space 28672K, 0% used [0x00000000daf80000,0x00000000daf80000,0x00000000dcb80000)
from space 4608K, 0% used [0x00000000dcb80000,0x00000000dcb80000,0x00000000dd000000)
to space 4608K, 0% used [0x00000000dd000000,0x00000000dd000000,0x00000000dd480000)
ParOldGen total 76800K, used 614K [0x0000000090e00000, 0x0000000095900000, 0x00000000daf80000)
object space 76800K, 0% used [0x0000000090e00000,0x0000000090e99838,0x0000000095900000)
Metaspace used 3204K, capacity 4496K, committed 4864K, reserved 1056768K
class space used 347K, capacity 388K, committed 512K, reserved 1048576K
}

在JDK9之后使用 -Xlog:gc+heap=debug

1
2
3
4
5
6
7
8
9
10
11
12
13
14
15
[0.017s][info][gc,heap] Heap region size: 1M
[0.017s][debug][gc,heap] Minimum heap 8388608 Initial heap 117440512 Maximum heap 1864368128
[0.091s][debug][gc,heap] GC(0) Heap before GC invocations=0 (full 0): garbage-first heap total 114688K, used 7168K [0x0000000090e00000, 0x0000000100000000)
[0.091s][debug][gc,heap] GC(0) region size 1024K, 2 young (2048K), 0 survivors (0K)
[0.091s][debug][gc,heap] GC(0) Metaspace used 334K, capacity 4494K, committed 4864K, reserved 1056768K
[0.091s][debug][gc,heap] GC(0) class space used 21K, capacity 386K, committed 512K, reserved 1048576K
[0.095s][info ][gc,heap] GC(0) Eden regions: 2->0(2)
[0.095s][info ][gc,heap] GC(0) Survivor regions: 0->0(0)
[0.095s][info ][gc,heap] GC(0) Old regions: 0->2
[0.095s][info ][gc,heap] GC(0) Archive regions: 0->0
[0.095s][info ][gc,heap] GC(0) Humongous regions: 6->0
[0.095s][debug][gc,heap] GC(0) Heap after GC invocations=1 (full 1): garbage-first heap total 8192K, used 745K [0x0000000090e00000, 0x0000000100000000)
[0.095s][debug][gc,heap] GC(0) region size 1024K, 0 young (0K), 0 survivors (0K)
[0.095s][debug][gc,heap] GC(0) Metaspace used 334K, capacity 4494K, committed 4864K, reserved 1056768K
[0.095s][debug][gc,heap] GC(0) class space used 21K, capacity 386K, committed 512K, reserved 1048576K

查看并发时间以及停顿时间

JDK9之前使用 -XX:+PrintGCApplicationConcurrentTime 或-XX:+PrintGCApplicationStoppedTime

1
2
Application time: 0.0037062 seconds
Application time: 0.0004107 seconds

JDK9以及之后使用 -Xlog:safepoint

1
2
3
4
[0.069s][info][safepoint] Safepoint "EnableBiasedLocking", Time since last: 42245400 ns, Reaching safepoint: 71800 ns, At safepoint: 47700 ns, Total: 119500 ns
[0.076s][info][safepoint] Safepoint "RevokeBias", Time since last: 6808300 ns, Reaching safepoint: 71400 ns, At safepoint: 85600 ns, Total: 157000 ns
[0.084s][info][safepoint] Safepoint "Deoptimize", Time since last: 7844900 ns, Reaching safepoint: 57900 ns, At safepoint: 28000 ns, Total: 85900 ns
[0.096s][info][safepoint] Safepoint "G1CollectFull", Time since last: 7976700 ns, Reaching safepoint: 48500 ns, At safepoint: 4234200 ns, Total: 4282700 ns